
by Paul F. Watson (author of The Weibull Bible) 1 Jul 22 Ed.
Introduction: Many engineers graduate having taken a single statistics course. Such introductory courses often present only the Gauss Bell Curve (Standard Normal Distribution) & its application to real world problems. When statistical analysis is needed, these engineers are truly the “one trick pony.”
While introductory classes provide a background in statistical methods, they create the false impression that most worldly phenomena can be described by the Gaussian statistical model with its weird assumptions:
While it is true that data measurements for some phenomena behave accordingly, most do not. Counter examples demonstrate failure of the Gauss Bell Curve for describing many phenomena.
Counter Examples:
There are literally hundreds of counter examples ranging from earthquake severity to Madeira Island wine production attesting to failure of the Gauss Bell Curve model. Contrary to many intro statistics classes, the Gauss Bell Curve is not universally successful for modeling an arbitrarily chosen data set.
The Underlying Problem:
Many real world processes result from a sequence of random events, & these are the subjects addressed by statistics. Many final outcomes may occur, and each has a likelihood that can be described by histogram. While histograms accurately describe probability of various results, such pictorial graphs do not enable mathematical analysis.
The first job of statistical analysis is to convert the pictorial histogram into a mathematical equation (probability density function) which, when graphed, should have features matching the histogram. These are called PDFs & are the basis of statistical analysis.
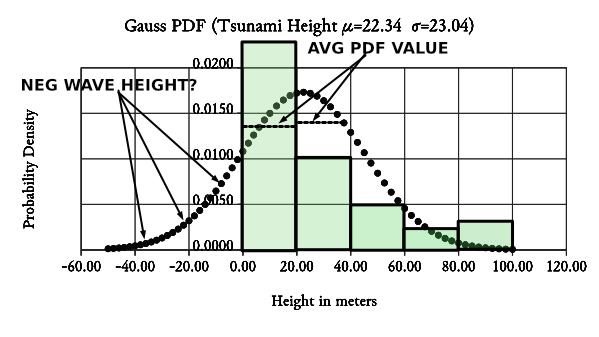
Below is a Gauss Bell Curve PDF, superimposed on a green histogram documenting historical tsunami heights. Comparison of PDF curve with green histogram shows histogram features ARE NOT captured by the Gauss PDF. In particular:
The fundamental problem for the Gauss PDF is its inherent symmetry with a maximum value at the average. These are not features of the actual wave distribution.
Confronted with inability of the Gauss Bell Curve to represent the true histogram shape, it is clear that additional distribution shapes are needed, and hopefully one of them will match the tsunami histogram. There are hundreds of different distribution shapes & some are listed below:
When confronted by a data-set, the analyst must evaluate different models until one is found that matches the data histogram.
Conclusions:
Statistics is applied to final outcomes that are fundamentally random at the event level. Despite inherent randomness, it is often true that frequency of “this” vs. “that” final outcome can be described by a histogram.
While histograms accurately describe data, they are not mathematically useful. For statistics, an equivalent PDF equation is created BUT IT IS ESSENTIAL that the PDF shape be verified as matching the data histogram. For the Gauss Bell Curve model, verification can be accomplished by any of the following:
Some engineers routinely apply the Gauss model because education did not provide alternatives nor disclose risks. If you are one of these (as I have occasionally been), I encourage you to improve your statistical skills. A good alternative to the Gauss Bell Curve is Weibull because of its unusual ability to twist & turn in conformance to data. It is more likely than other models to match a data histogram.
Introductory Textbooks:
Many Weibull books are not comprehendable to learners. May I suggest:
Copyright 2022 by Paul F. Watson, All Rights Reserved
Initial Release: 1 July 2022