The Weibull Bible Errata Updates
Especially in mathematics books, it is difficult to identify & correct all errors. Below is a list of known errors discovered after printing. These corrections need to be applied to your studies of The Weibull Bible published in 2022. If you find anything else that looks wrong, please e-mail me (paul-watson@sbcglobal.net) & identify the page & describe the issue.
Page 33 Benard's Equation: Wrong sign in numerator. Equation should be:
Page 69 problem 6. Revise table header from Data Point Number -> should be Data Set Size
Page 104 3rd text line:
WRONG: CDF represents probability as area under...
Should be: PDF represents probability as area under ...
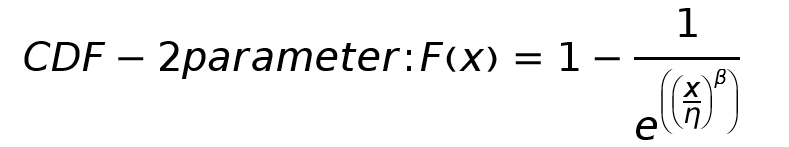
Page 106 Eq 6-4: Equation contains X-Xo. But Xo is zero!
The corrected equation should be:
Page 144 3rd Bullet. Replace run both ... with "run both 2 and 3 parameter analyses...
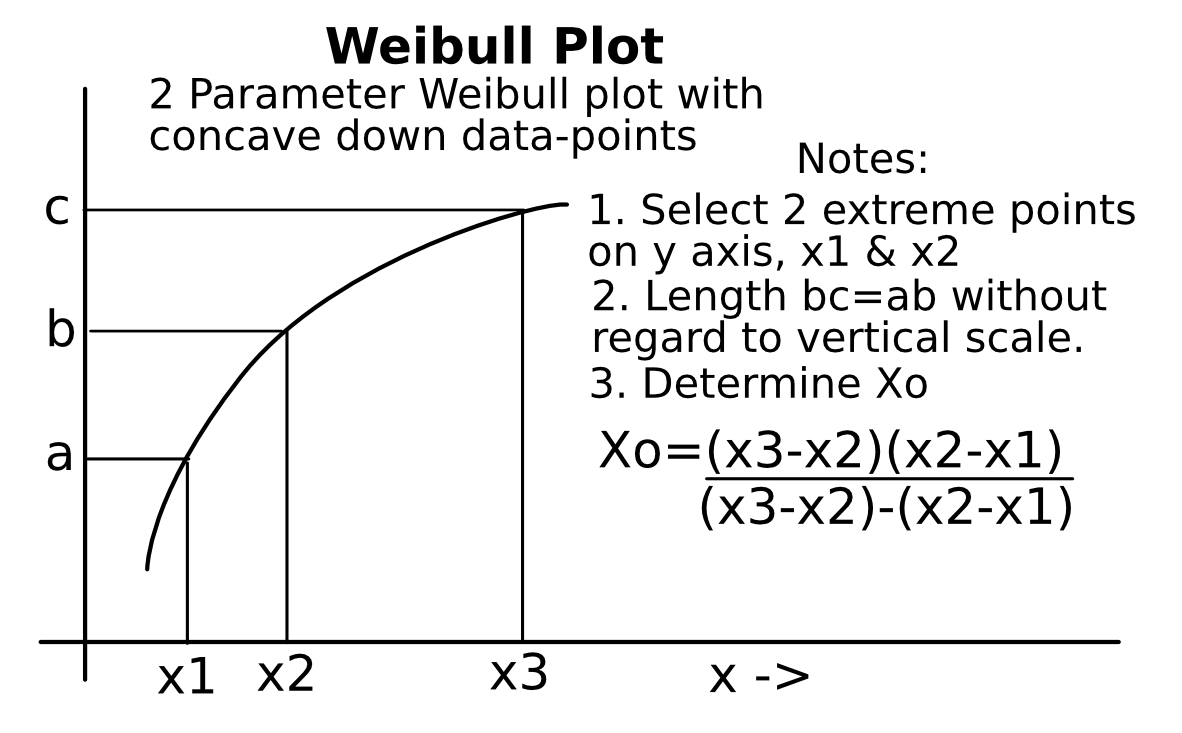
Page 198 Figure 10-8
Should say: Length bc=ab without regard to vertical scale.
Incorrectly shows bc=ac
Corrected figure appears as below:
Page 236 Appendix D
The following paragraph should be added for clarification (space permitting)
A married Irishman was asked whether he had a child. He answered, 'Yes, 3 times over.' Following his reasoning, the probability of a family having a child can be computed based on data from the Central Statistics Office, Ireland (1)
- 30.8% of families have 0 children
- 27.7% of families have 1 child
- 25.3% of families have 2 children
- 11.9% of families have 3 children
- 4.3% of families have 4 children
The probability of a family man picked at random having a child is the sum of the probabilities for each way it can happen. i.e.
P(children) = P(1 child)+P(2 child)+P(3 child)+p(4 child)
P(children) = 27.7% + 25.3% + 11.9% + 4.3 % = 69.2%
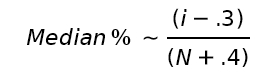
This same concept applies to computing median percents as shown below.
Footnote 1: from Central Statistics Office Ireland, Census of Population 2022 Profile 3 - Households, Families & Child Care. www.so.ie website
Page 236 Appendix D:
WRONG: Terms of the Binomial were incorrectly numbered Left to Right when the opposite is required by probability theory. Revise paragraph as shown below.
3. There are five ways data data-point 1 (the smallest) can be contained in a PDF probability region (i.e. the Median Percent) representing 5 data-points. The region might contain only the smallest data-point. Or it might contain the smallest two data-points... or it might contain all five data-points. The region representing the 1st Median Percent is thus the sum of these probabilities. In conclusion, to compute the region 50% likely to contain the 1st data point, we must sum the probability of terms for each of the following conditions.
- Exactly one data-point in ... (5th term of Binomial Eq D-1)
- Two data-points in ... (computed from 4th & 5th terms of Binomial Eq D-1
- Three data-points in ... (computed from 3rd through 5 terms of Eq D-1
- Four data-points in ... (computed from 2nd through 5th terms of Eq D-1
- All five data-points in ... (computed from 1st through 5th terms of Eq D-1
Note: The referenced Binomial terms are from Eq D-1 page 234
Copyright 2025 by Paul F. Watson
Updated 2 September 2025