Intended Audience: General Readership
 Introduction: I recently told a friend I had
confirmed OSU Professor Chris Goldfinger’s (1)(4) 40% probable prediction
of a major earthquake off the Oregon coast in the next 50 years. My friend
reacted with understandable skepticism saying “I wouldn’t put much stock
in such predictions.” I began to reflect on why I believe such predictions
are possible, and why after the last earthquake in 1700, the next one will
be relatively soon.
Introduction: I recently told a friend I had
confirmed OSU Professor Chris Goldfinger’s (1)(4) 40% probable prediction
of a major earthquake off the Oregon coast in the next 50 years. My friend
reacted with understandable skepticism saying “I wouldn’t put much stock
in such predictions.” I began to reflect on why I believe such predictions
are possible, and why after the last earthquake in 1700, the next one will
be relatively soon.
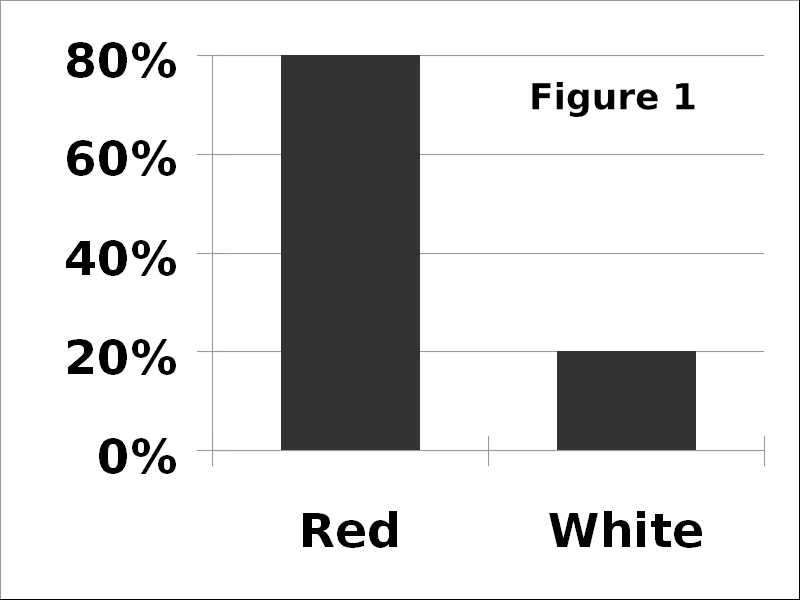
A Simple Example: Intro statistics classes often have lots of examples of an Urn filled with 80 red beans and 20 white beans. If thoroughly mixed, it is obvious that a child grabbing a single bean is 80% likely to get a red bean. This conclusion shows statistics can “reach into the future” when analysis is based on good information. Still, this example falls short of justifying predictions based on complex statistical graphs.
Red Bean & White Bean Histogram: The Urn example can be reduced to a histogram that is similar to statistical PDF graphs used by scientists like Professor Goldfinger. Figure 1 contains exactly the information provided by the Urn example above.
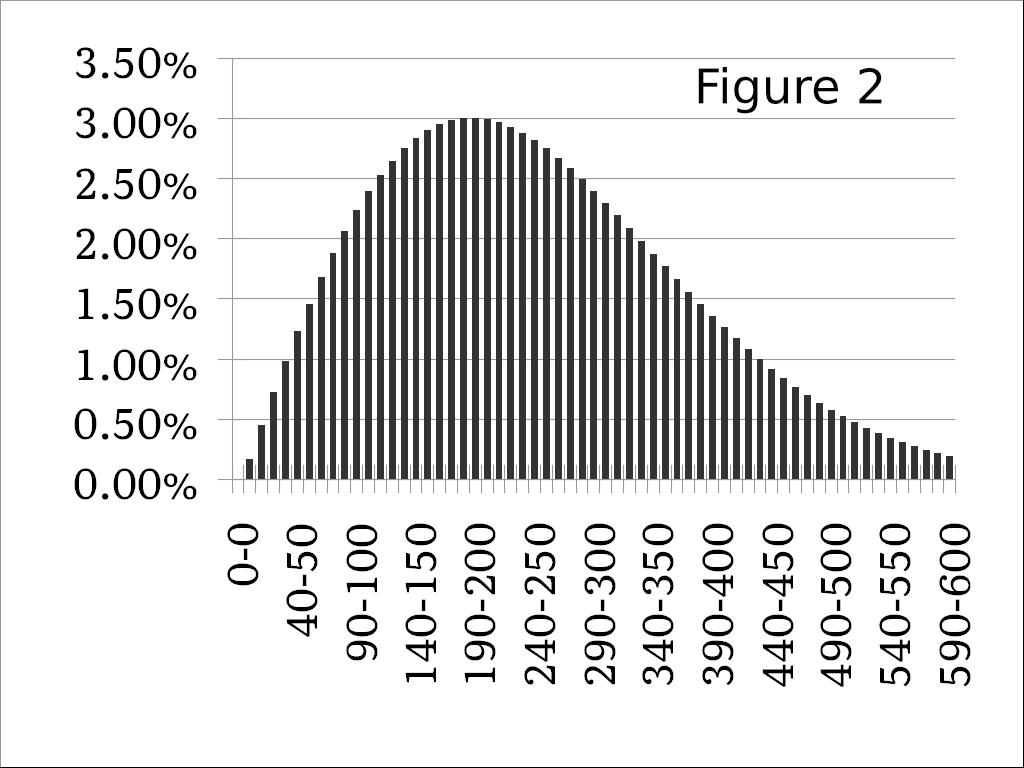
Often, information in histograms includes more than two categories shown for the Urn. For the earthquake prediction, historical information exists regarding 40 major earthquakes over a 10 thousand year period. (2) Weibull statistics enables this information to be turned into a histogram similar to the Urn graph (see Figure 2).
Figure 2 represents probability of intervals between earthquakes in the same way the Urn histogram represents the likelihood of “grabbing” a bean of whatever color.
Considering the Urn example, if we grab 10 red beans in a row, then the number of red beans has been decreased, so the probability of “grabbing” a white bean has changed. The histogram must be updated. In a like way, the last big earthquake occured 320 years ago (3) so the earthquake histogram needs update, to remove bars left of 320 years (which did not occur) and to increase the bars to the right to show100% certainty that an earthquake will eventually occur. The updated histogram is Figure 3 below.
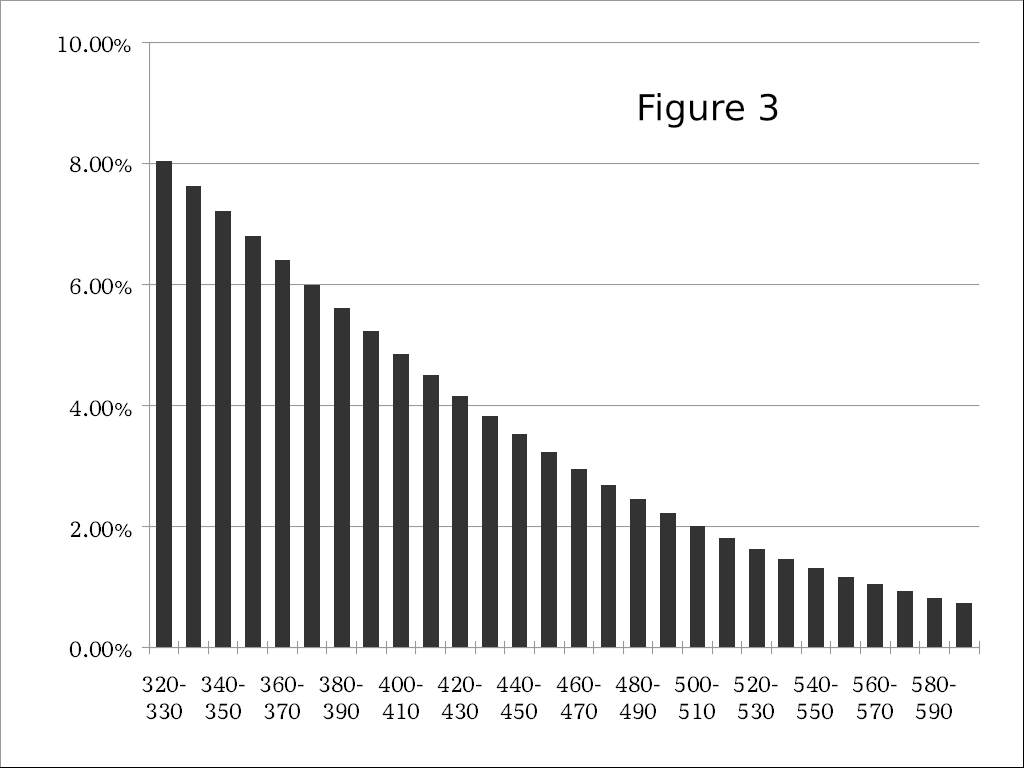
The updated earthquake histogram Figure
3 has bars indicating the probability of an earthquake within 10 year
spans. ‘Now’ is 320 years after the last major quake in 1700. (3)
Figure 3 is much like the Urn histogram, where each bar represents the likelihood of grabbing a colored bean. To determine the likelihood of an earthquake in the next 50 years, we simply add the bars representing:
The total for 50 years based on bars is 36.03%. More accurate Weibull mathematics done without bars indicates 40% which matches Professor Goldfinger’s prediction.
Is the Urn Problem Really Similar to the Earthquake Problem? The Urn problem concerned a number of beans having two colors existing in the Urn. The earthquake problem is a bit different, because we are discussing future occurrences rather that existent reality. We should consider whether our comparison is fair.
Statisticians believe they are examining
"the fruit of a process”, and not the items themselves. For the Urn, the
process was historical. A Professor counted and placed beans in an Urn.
For the earthquake problem, statisticians believe there is a ongoing
geological process in which the Juan de Fuca crustal plate forces itself
under the North American crustal plate at 12 feet per century. The edges
of the crustal plates compress like springs, until eventually they
“rip”, sending vibrations across the earth’s surface (i.e. an
earthquake). The argument of statisticians is that "the fruit of the
process" both past and future is part of the same statistical
population; and thus can be analyzed by Weibull methods.
If earthquakes are believed to be controlled by “whim of gods;” then statistical prediction has no basis; but, if we believe earthquakes result from an ongoing and constant process, then the process should continue to create intervals between earthquakes similar to those of the past.
Conclusion: Interpreting a Weibull analysis as characterization of process, enables statistical analysis to reach into the future with its predictions. This interpretation applies to earthquakes, industrial and a wide range of other phenomena.
Based on extensive core samples, geologists believe the severity and date of major earthquakes during the last 10 thousand years are known. Weibull analysis of the data seems to confirm its accuracy, and predicts a 40% chance of a major off shore Oregon earthquake in the next 50 years. Given a characteristic interval between quakes of 279 years, we are already overdue at 322 years.
Footnotes:
1. Chris Goldfinger PhD, Oregon State
University Professor College of Earth, Ocean, and Atmospheric Sciences
2. 10,000 years of Cascadia earthquakes, “OregonLive” from The Oregonian. Documenting time line of 40 major earthquakes during the last 10,000 years. Based on ocean floor core samples at more than 50 sites from 1999 through 2009.
3. The last great Cascadia earthquake occurred in 1700, and the resulting tsunami traveled across the Pacific and struck Japan. See USGS Professional Paper 1707, “The orphan tsunami of 1700—Japanese clues to a parent earthquake in North America” by Brian F. Atwater, Satoko Musumi-Rokkaku, Kenji Satake, Yoshinobu Tsuji, Kazue Ueda, and David K. Yamaguchi
4. Oregon State University Newsroom,
"Odds are 1-in-3 that a huge quake will hit Northwest in next 50 years.
https://today.oregonstate.edu/archives/2010/may/odds-huge-quake-Northwest-next-50-years
5. Reference Spreadsheet File documents\CascadiaHist.pmdx
Copyright 2022 by Paul F. Watson
Questions? Contact paul-watson@sbcglobal.net